Automate Weekly Reports: Five Numbers, One Email
To automate weekly reports, pick five numbers that matter, pull them from your existing tools into one plain-text email, and schedule it to send every Monday. Stop building dashboards nobody opens. A ten-person business needs a short, honest summary with change indicators, not another spreadsheet to maintain.
Which five numbers should a small business actually report weekly?
Pick five numbers that show cash, pipeline, and operations: cash balance, invoices due, new leads, jobs completed, and overdue tasks. These work across most service businesses and tell you if the week was healthy. Avoid vanity metrics like social followers. Each number must be owned by one tool.
Cash balance is the one number that never lies. Revenue can look strong on paper while your account sits empty because three clients have not paid. A weekly cash figure tells you whether you can cover payroll, buy materials, or afford the new hire without opening a spreadsheet. It is the fastest health check a ten-person firm can run.
Invoices due shows what is owed to you right now. New leads shows whether the pipeline is filling or drying up. Jobs completed shows whether work is actually moving. Overdue tasks shows whether your internal commitments are slipping. Together they cover money in, money out, and whether the operation is running.
The rule for choosing numbers is simple: only pick a figure that already lives in one of your tools. If your accounting software holds the cash balance and your CRM holds the leads, a weekly report can pull both without anyone retyping anything. If a number requires someone to open three tabs and add things up by hand, it will stop being reported by week three. That is the test worth applying before you automate anything else, and it is the same logic behind what tasks should a small business automate first.
Where do the numbers come from automatically?
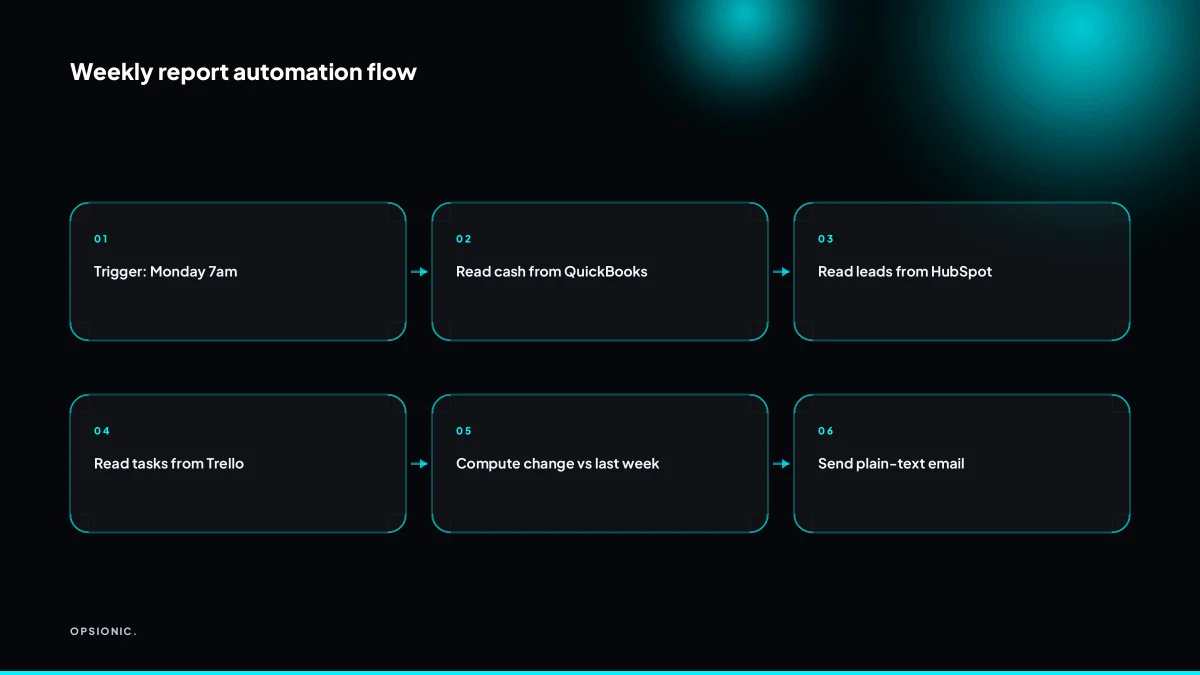
Connect your accounting tool, CRM, and project board to an automation platform. For example, QuickBooks holds cash and invoices, HubSpot holds leads, and Trello holds tasks. The automation reads those sources on schedule and writes the latest values into your report.
Each of the five numbers gets a named source. Cash on hand comes from your accounting tool. New leads come from the CRM. Jobs or tasks completed come from the project board. Overdue invoices come from the accounting tool again, filtered by due date. Hours logged, if you track them, come from a time tracker or the project board. Once you assign a source to each number, the automation only has to ask one system per line.
Most mainstream tools expose an API, and automation platforms ship native integrations for the common ones. QuickBooks, HubSpot, Trello, Xero, Pipedrive, and Google Sheets all connect without writing code. The automation runs on a schedule, pulls the current value from each source, and drops it into a plain-text email template. If a tool has no direct integration, the fallback is a scheduled export to Google Sheets or a webhook, which the automation then reads. That is the moment to weigh automate data entry between apps against simply changing tools.
| Number | Likely source | Integration path |
|---|---|---|
| Cash balance | QuickBooks or Xero | Native API |
| New leads this week | HubSpot or Pipedrive | Native API |
| Jobs completed | Trello or Asana | Native API |
| Overdue invoices | QuickBooks or Xero | Native API, filtered |
| Hours logged | Harvest or Clockify | API or CSV export |
The weak point is never the cash balance. It is the tool with no integration, where someone still exports a CSV every Friday. If two of your five sources need manual exports, the report is not automated; it is just a nicer template. Pick sources that can be read by machine, or accept that one number stays manual for now.
Not sure which of these applies to you?
Answer six questions and see what we would automate first in your business, and what it is worth.
How do you connect the tools without hiring a developer?
Use a no-code automation platform like Zapier, Make, or n8n. These tools have pre-built connectors for common apps, so you can set up a workflow in an afternoon. You don’t need to write code, but you do need to know exactly which fields you want from each tool.
- Pick your trigger. In Zapier, create a new Zap and choose the app where the week’s data first appears. For a cash balance, that might be a new row in a Xero report or a scheduled trigger that runs every Friday at 08:00.
- Pull the fields you need. Add a step for each source app and select only the fields that feed your five numbers. If you want total invoices issued, grab the invoice amount and date, not the customer’s phone number.
- Send one plain-text email. Add a final step using Gmail or Outlook. Write the body with five placeholders, one per number, and set the recipient to yourself and anyone else who actually reads it.
When a tool lacks a native connector, you have three options. You can use Zapier’s webhooks to accept a POST request from the source, which works if the tool can send data out. You can route the data through a middle step like Google Sheets, where the source exports a CSV and Zapier reads the sheet. Or you can use Make or n8n, which sometimes have community-built modules that Zapier does not. The honest answer is that some tools simply refuse to share data, and at that point the number stays manual or you change tools.
Starting with one number is smarter than all five. Get the cash balance flowing into an email every Friday. Once that runs for two weeks without you touching it, add the second number. If you try to build all five at once, you will spend an afternoon debugging a field mapping for the least important metric and abandon the whole thing. This is the same logic as starting with one process first: a working single number beats a broken dashboard.
What does the actual email look like when it arrives?
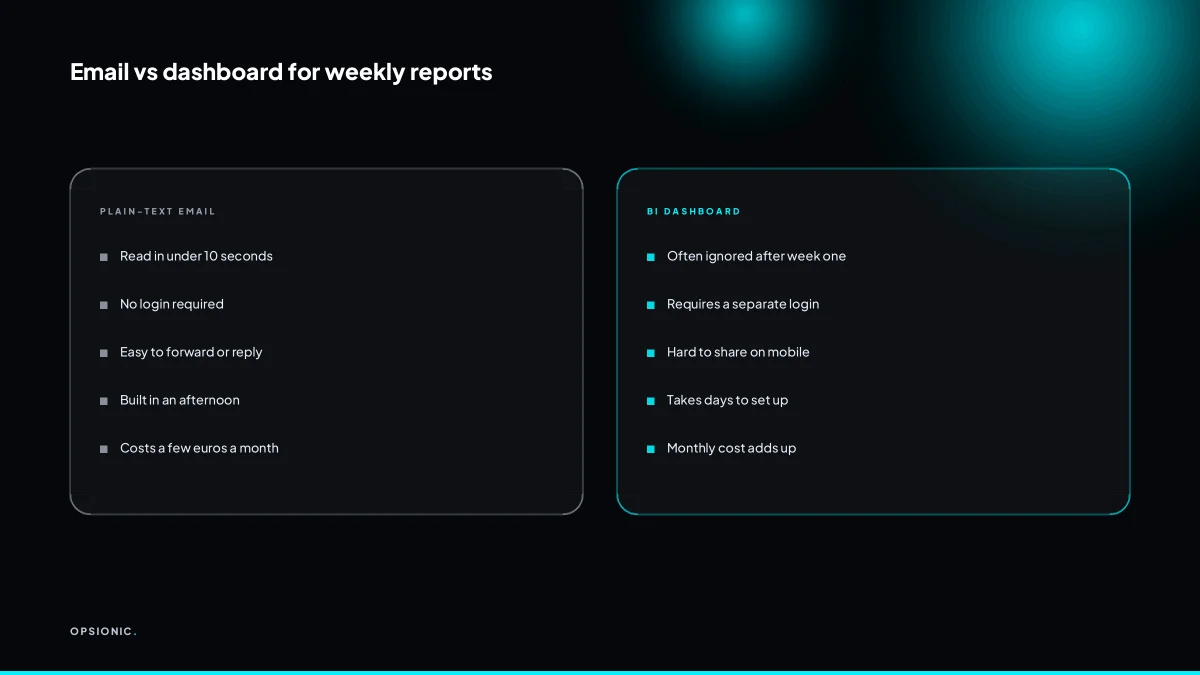
A plain-text email with a subject line, five lines of numbers, and a one-line change indicator for each. No attachments, no formatting, no charts. For example: “Cash: EUR 12,400 (+8%)”. The reader can scan it in ten seconds and reply if something looks wrong.
Here is a worked example for a fictional plumbing firm. The owner wants five numbers every Monday morning: cash in the bank, open invoices, jobs booked for the week, quotes sent but not accepted, and overdue invoices. The automation pulls each figure from the bookkeeping and job software, calculates the change against the previous week, and sends this:
Subject: Weekly numbers, 17 March
Cash: EUR 18,240 (+6%)
Open invoices: EUR 9,830 (-12%)
Jobs booked this week: 14 (+4)
Quotes waiting: 6 (-3)
Overdue: EUR 2,110 (-9%)
The arithmetic is simple. Last week cash was EUR 17,210. This week it is EUR 18,240. The difference is EUR 1,030, which divided by EUR 17,210 gives 5.98%, rounded to +6%. The same sum runs for each line. You do not need a BI tool for that. You need a script that reads two dates and subtracts.
Plain text beats HTML or a PDF because it renders the same on every phone. A formatted report that looks tidy on a desktop often arrives as a zoomed-out mess on a mobile, and the owner ends up pinching and scrolling to find the one number that matters. Plain text also loads instantly on a weak connection and pastes cleanly into a WhatsApp message to a business partner.
For the change indicators, avoid bare percentages with no direction. “+8%” is fine when cash goes up, but when overdue invoices rise, write “+12% (up, needs attention)” or simply “Up EUR 410”. The goal is not to alarm the reader. It is to flag what moved enough to deserve a look. A rule of thumb: only attach a comment when the change exceeds a threshold you set, such as 10% or EUR 500. Below that, the number speaks for itself.
What is this costing you now?
Based on removing half of that time.
How do you show change from last week without manual calculation?
Let the automation store last week’s values in a simple table, then compute the difference when building the email. Most automation platforms can do this with a formula step. You only need to keep one row of history per metric, not a whole spreadsheet.
Keep that history in a single row with columns for each metric: cash balance, invoices due, jobs quoted, whatever you track. When the automation runs, it reads the current values, subtracts last week’s stored numbers, and writes the new values back over the old row. One row, overwritten weekly. Nothing accumulates.
Then add a formula step that turns the difference into a percentage: (current minus previous) divided by previous, times 100. For amounts in EUR, the raw difference often matters more than the percentage. A EUR 410 rise in overdue invoices lands harder than “+12%”. Put both in the email when either crosses your threshold.
The first week has no previous value. Skip the change column entirely, or write “baseline” and let the second week carry the first comparison. Do not fake a zero baseline; a formula dividing by zero breaks the email. Before you build any of this, run the sums from automation ROI calculation small business to confirm the saved hour is worth the build.
What usually breaks in automated reports and how do you avoid it?
The most common failures are a tool changing its API, a field being renamed, or a data source going quiet. You avoid this by monitoring the automation’s error logs and setting up an alert if a number is missing. Test the report every month, not just at setup.
The first breakage point is the connection. A tool updates its API, an access token expires, or a password changes and nobody tells the automation. The symptom is an email that stops arriving, or arrives with blank sections. The fix is an error log you actually read, plus a monthly test run that forces a fresh pull.
The second is the field. Someone renames “Job Total” to “Invoice Total” in your job software. The automation keeps running, but the number it grabs is now empty or wrong. The symptom is a report that looks complete while quietly reporting nonsense. The fix is a missing-data alert: if any of the five numbers comes back null, the automation sends you a short email saying which field failed, instead of sending the report.
The third is the source going quiet. A payment gateway pauses, a booking calendar syncs nothing for a week, or a plugin update stops writing rows. The symptom is a week of zeros that looks like a slow week. The fix is the same alert, set to fire on zero as well as null, because a plumbing firm doing zero jobs in a week is rare enough to check.
Even with alerts, glance at the raw numbers in the source tool once a month. An alert catches missing data, not data that is present but wrong. A typo in a price list, a job logged under the wrong customer, a double entry: none of those trigger a null. Ten minutes comparing the report to the source catches drift before a decision rests on it. This is the failure pattern behind most abandoned automations, and it is cheaper to prevent than to rebuild.
Want this running in your business next week?
A relaxed 20-minute video chat. Camera on or off. You leave with a plan whether or not you hire us.
- No call unless you ask for one
- From EUR 399 a month, no setup fee
- Built and run for you, not handed over as homework
Sources we checked
Questions people ask
Can I automate weekly reports from Excel without coding?
Yes, if the data already reaches Excel or Google Sheets. Use Power Query in Excel or a scheduled Zapier, Make or n8n workflow that reads the sheet, works out the change against last week, and emails the result. You need no code, but you do need one clean row per metric.
How often should I update the numbers in my weekly report?
Weekly suits most small firms. Cash, invoices and pipeline move slowly enough that daily figures add noise rather than insight. Run the automation at the same time each week, such as Friday at 17:00 or Monday at 08:00, so the numbers are always compared over the same seven-day window.
What if my tools don't have integrations with Zapier or Make?
You have three options. Check whether the tool can send a webhook, route a scheduled CSV export through Google Sheets, or switch to an alternative that does expose an API. If none of those work, that number stays manual, and it is worth questioning whether the tool is earning its place.
Is a weekly email enough, or do I also need a monthly report?
Weekly covers operations: what moved, what slipped, what needs a look now. A monthly view is still useful for cash trends, tax set-asides and comparing months. Keep the weekly email to five numbers. Add a longer monthly summary only if you actually act on it.
How do I keep the report from looking like spam to my own team?
Send it from a named person, keep the subject line identical each week, and include only the five numbers plus a short note where something crossed a threshold. No attachments, no marketing styling. People open a short, predictable email from a colleague. They ignore a formatted newsletter.
What's the cheapest way to automate a weekly report for a solo business?
Start with the free tier of an automation platform and one number, such as cash balance. A single scheduled workflow reading one source and sending one email often fits inside a free plan. Add numbers only once the first one runs untouched for two weeks.
Can I include charts or graphs in a plain-text email?
Not in the body, and that is the point. Plain text renders identically on every phone and loads instantly. If you want a visual, link to a single hosted chart rather than embedding one. Most owners read five numbers faster than they read any graph.